December 2016 - Market News
The latest stats by the Real Estate Board of Greater Vancouver report a continued slump in sales in and around the Vancouver area, specifically in the detached housing market. Historically, November is a slow time for home sales and in a typical year none of the latest figures should be alarming. However, this is not a typical year as we all have witnessed. Following a year of double-digit increases, the BC Real Estate Association is now predicting average home sales prices will drop by as much as 8.7% in 2017 (down 14.5% from the August prediction of a 5.8% increase). The uncertainty in the market along with new government regulations has also lead the BCREA to revise its prediction for unit sales to a 15.4 % decrease for 2017. To view the full article please click here
North Vancouver saw a 38% drop in gross sales for the month of November compared to one year ago. With only 61 units sold in November, this was a 40% decline from last year when November recorded 102 units sold. A 106% increase in active listings (from 132 to 272) from one year ago illustrates that there are plenty of homes for sale in North Vancouver. A 2% increase in average price per unit in the past year, from $1,630,089 to $1,676,607 shows that although overall sales figures may be lagging, the price in North Vancouver is steady.
West Vancouver’s average price per unit decreased slightly. A 2% decrease was recorded as the average price per unit was $3,057,384 from $3,124,170 (2015). Overall gross sales fell 68% for November from $256,181,980 to $79,492,000. The low gross sales directly relates to a decrease in units sold with a 68% drop from 82 to 26. Active listings rose 5% from 370 to 391.
The wait and see attitude that we have seen in recent months has resulted in a 53% decrease in gross sales for Vancouver West. November 2015 had historic gains and gross sales were $583,613,225 while this year November gross sales totalled $270,895,576. And like other regions in our area, the overall units sold for the month were down 58% from 163 to 68. Even with these declining sales, the average price per unit improved 12% from $3,537,049 to $3,983,758.
In November of 2015, the sale to active listing ratio was 43.5%. November 2016 recorded 26.4% sales to active listings ratio. While there is a decrease, analysts believe ratios that are 20% or higher are categorized as being in a “sellers’ market”. The market is still strong and prices are holding. If you are thinking of buying or selling your home, give me a call, I’d love to help.
Source: Real Estate Board of Greater Vancouver
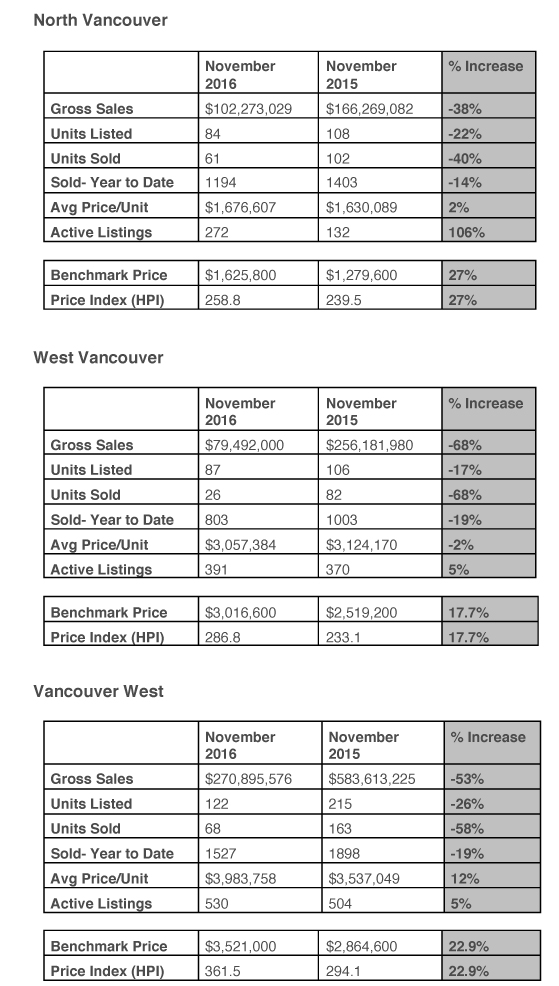
Benchmark Price: Estimated sale price of a typical property, based on a set of common qualities of homes within each market.
Price Index (HPI): Index numbers estimate the percentage change in price on typical and constant quality properties over time. All figures are based on past sales.